
Analysis
A Projection Is Not a Probability: How NFL Prop Forecasts Should Be Built
A 275-yard projection is one expected result. A prop decision requires the full range of outcomes, an exact threshold, a fair market probability, and a timestamp.

By J. Grant · updated August 26, 2026
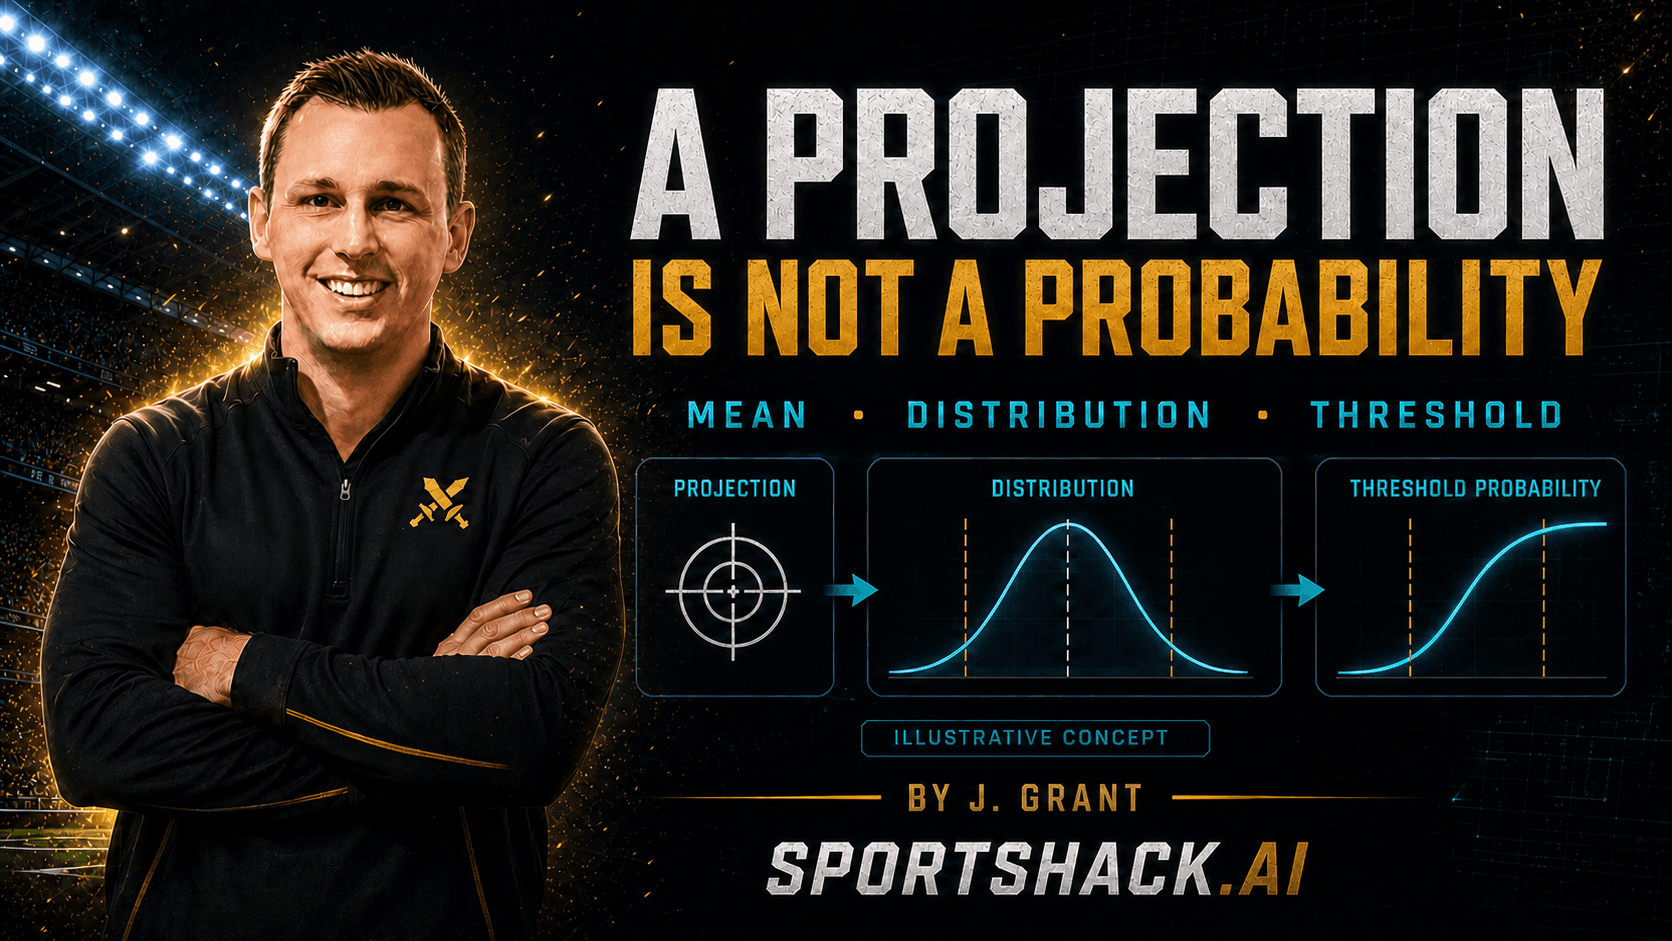
Fantasy football players are comfortable with projections. A quarterback is projected for 275 passing yards. A wide receiver is projected for 72 receiving yards. A running back is projected for 4.2 catches.
Those numbers help rank players and build lineups. They do not answer every prop question.
If a quarterback projects for 275 yards, what is his probability of reaching 250? What about 275, 300, or 325? The same projection mean sits behind every question, but the probability changes at each threshold.
That difference is where a lot of bad prop analysis begins.
The Mean Is Only the Middle of the Story
A projection is the expected value for the statistic. It is the center of the player's range, not a promise that he will finish near that number.
Two quarterbacks can share the same 275-yard projection and have different probabilities of reaching 300.
One may play in a stable, high-volume offense that produces a narrow range of outcomes. The other may have lower expected volume but greater deep-ball variance. Their averages can land in the same place even though the shape of their possible results is different.
The same issue appears at every position:
Get the free 2026 fantasy football cheat sheet
Want everything now? Get lifetime access
Every Threshold Is Its Own Contract
The line cannot be separated from the probability.
A player's chance of producing 3+ receptions is not his chance of producing 5+. The 250-yard passing contract is not interchangeable with the 275-yard contract. We should never average the probabilities, interpolate a missing threshold without a validated method, or treat one available market as if it represented the entire player projection.
The correct workflow keeps the exact player, event, statistic, threshold, and direction together.
For every threshold, the process needs:
1. The immutable pregame projection.
2. The probability distribution around that projection.
3. The probability of the exact stated outcome.
4. The current market probability for that same contract.
5. The timestamp and settlement rules.
If the current quote is missing, stale, one-sided, or unparseable, the market probability is unavailable. Missing data is not zero, and it is not permission to manufacture a comparison.
Turning a Projection Into a Probability
The first step is building the strongest mean projection possible. That is where team totals, play volume, depth charts, player shares, coaching, injuries, and matchup context belong.
The second step is estimating the range of outcomes. Historical player-game results help answer how volatile a statistic has been, how the distribution changes with opportunity, and how often the tails occur.
The distribution cannot be chosen only because it is convenient. NFL yardage is bounded at zero and often right-skewed. Touchdowns and receptions are count outcomes. A simple Normal distribution can misprice lower-volume players and the tails.
The third step is calibration. If a model assigns 60% to a large group of events, roughly 60% of those events should occur over time. Calibration is not about getting every player correct. It is about making the probabilities honest across the full sample.
That is why Sportshack evaluates Brier score, log loss, and calibration rather than reporting only how often an over or under won.
Why the Football and Quant Blend Helped
The 2025 retrospective test showed that the two forecasting approaches carried different strengths.
The football model's passing-yard projections produced the best probability result for that family, with a player-start-balanced Brier score of 0.1644. The 50/50 blend was best for passing touchdowns at 0.1799 and receiving yards at 0.1173.
The overall 50/50 blend finished at 0.1312, compared with 0.1369 for the football model and 0.1364 for the Quant model.
The football projections helped establish the expected opportunity. Quant helped describe the historical uncertainty around the mean. The combined probability improved because the methods did not make identical mistakes.
That does not mean every statistic should use the same blend. Passing yards still favored the standalone football model. The model choice should remain family-specific and should be updated only with forward evidence.
The Market Side Must Be Fair Too
A listed price is not automatically the fair probability of the outcome.
Sportsbook markets contain margin. A two-sided market has to be devigged before the probabilities can be compared honestly. Prediction markets can have spread, fees, thin liquidity, stale quotes, or one-sided books. The available quote may not represent an executable price for meaningful size.
The comparison should therefore be described as a model-versus-market probability gap—not a recommendation or a measured financial outcome.
Before treating a difference as useful, these questions need answers:
Before and During the Event
The Sportshack probability is a frozen pregame forecast. It should never mutate to follow the market after publication.
Before kickoff, it can be compared with the current pregame market. During the event, the original forecast may remain visible only when it is clearly labeled as pregame and the comparison uses the current market. It does not become an in-game model merely because the market continues trading.
At the authoritative cutoff, the comparison ends. The result is then graded against the outcome, with every hit and miss retained.
That permanent record matters. A projection process improves when it is forced to remember what it actually said before the game.
In the end, a projection is the beginning of a prop forecast, not the finished product. The exact threshold, distribution, market probability, timing, and contract rules finish the job.
The question is not only, “How many yards do I project?”
The better question is, “What is the honest probability of this exact outcome, and what evidence supports the difference between the model and the market?”
The 275-yard example is illustrative. It is not a current player forecast or market quote. Analytics only. No bet placement.
Take the rankings with you — the free 2026 fantasy football cheat sheet
Want everything now? Get lifetime access